



visualising the data
Climate services are the provision of climate information to support decision-making. But they are not just technical tools – they are also a narrative concept, explaining how information is tailored, shared and used.
Climate services depend on various components, such as:
Climate services depend on various components, such as:
The decision-making
context of users
It refers to the kind of decisions the climate service supports, including its geographical, social, and political context.
The delivery mode and evaluation practices
It should include the tailored aggregation and combination of data and processes to match the decision and context of the service client.
Knowledge systems
Different types of knowledge systems besides climate information: indigenous knowledge, domain knowledge of the industry, etc.
The ecosystem of actors and co-production processes
Dialogue between provider, user and intermediaries


Much like combining ingredients in a recipe, different configurations of these components can produce more or less successful climate services.
Using the analogy of a pizza, we show how different criteria – each associated to one of the four components – are combined in a climate service, just like ingredients that make a recipe.
Just as a good pizza can be judged by how tasty, crispy, or original it is, the success of climate services can be evaluated in different ways.
For instance, a successful climate service could be one that supports the creation of new scientific knowledge, leads to user satisfaction, supports decision-making, or enables scalability and reuse.











Here are the recipes!
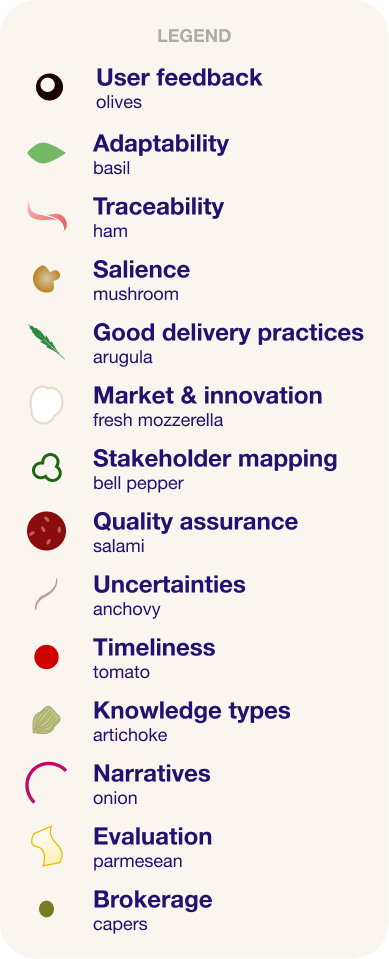
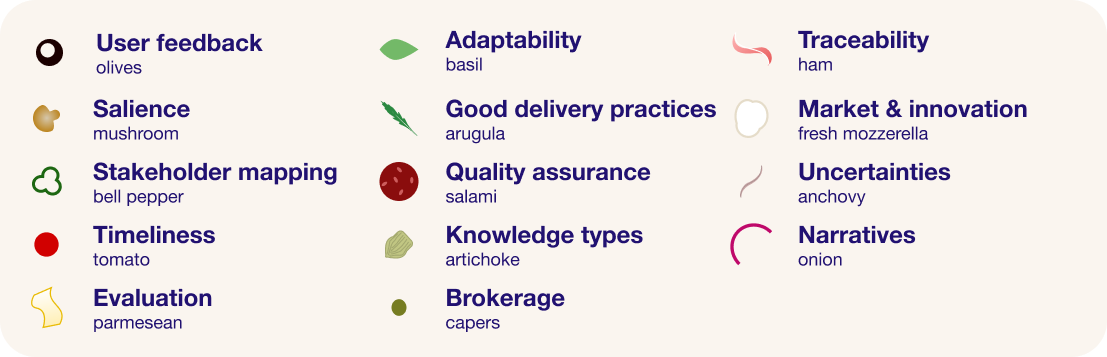
Use the legend to learn which criteria is represented by which ingredient.
You can hover over the pizzas to see the quantities of each ingredient in all of the recipes.
- Use the “VIP relevant” filter to highlight the most important criteria
- A positive sign (+) means that the presence of a criterion supports that type of success
- A negative sign (–) means that that absence of a criterion is associated with that type of success


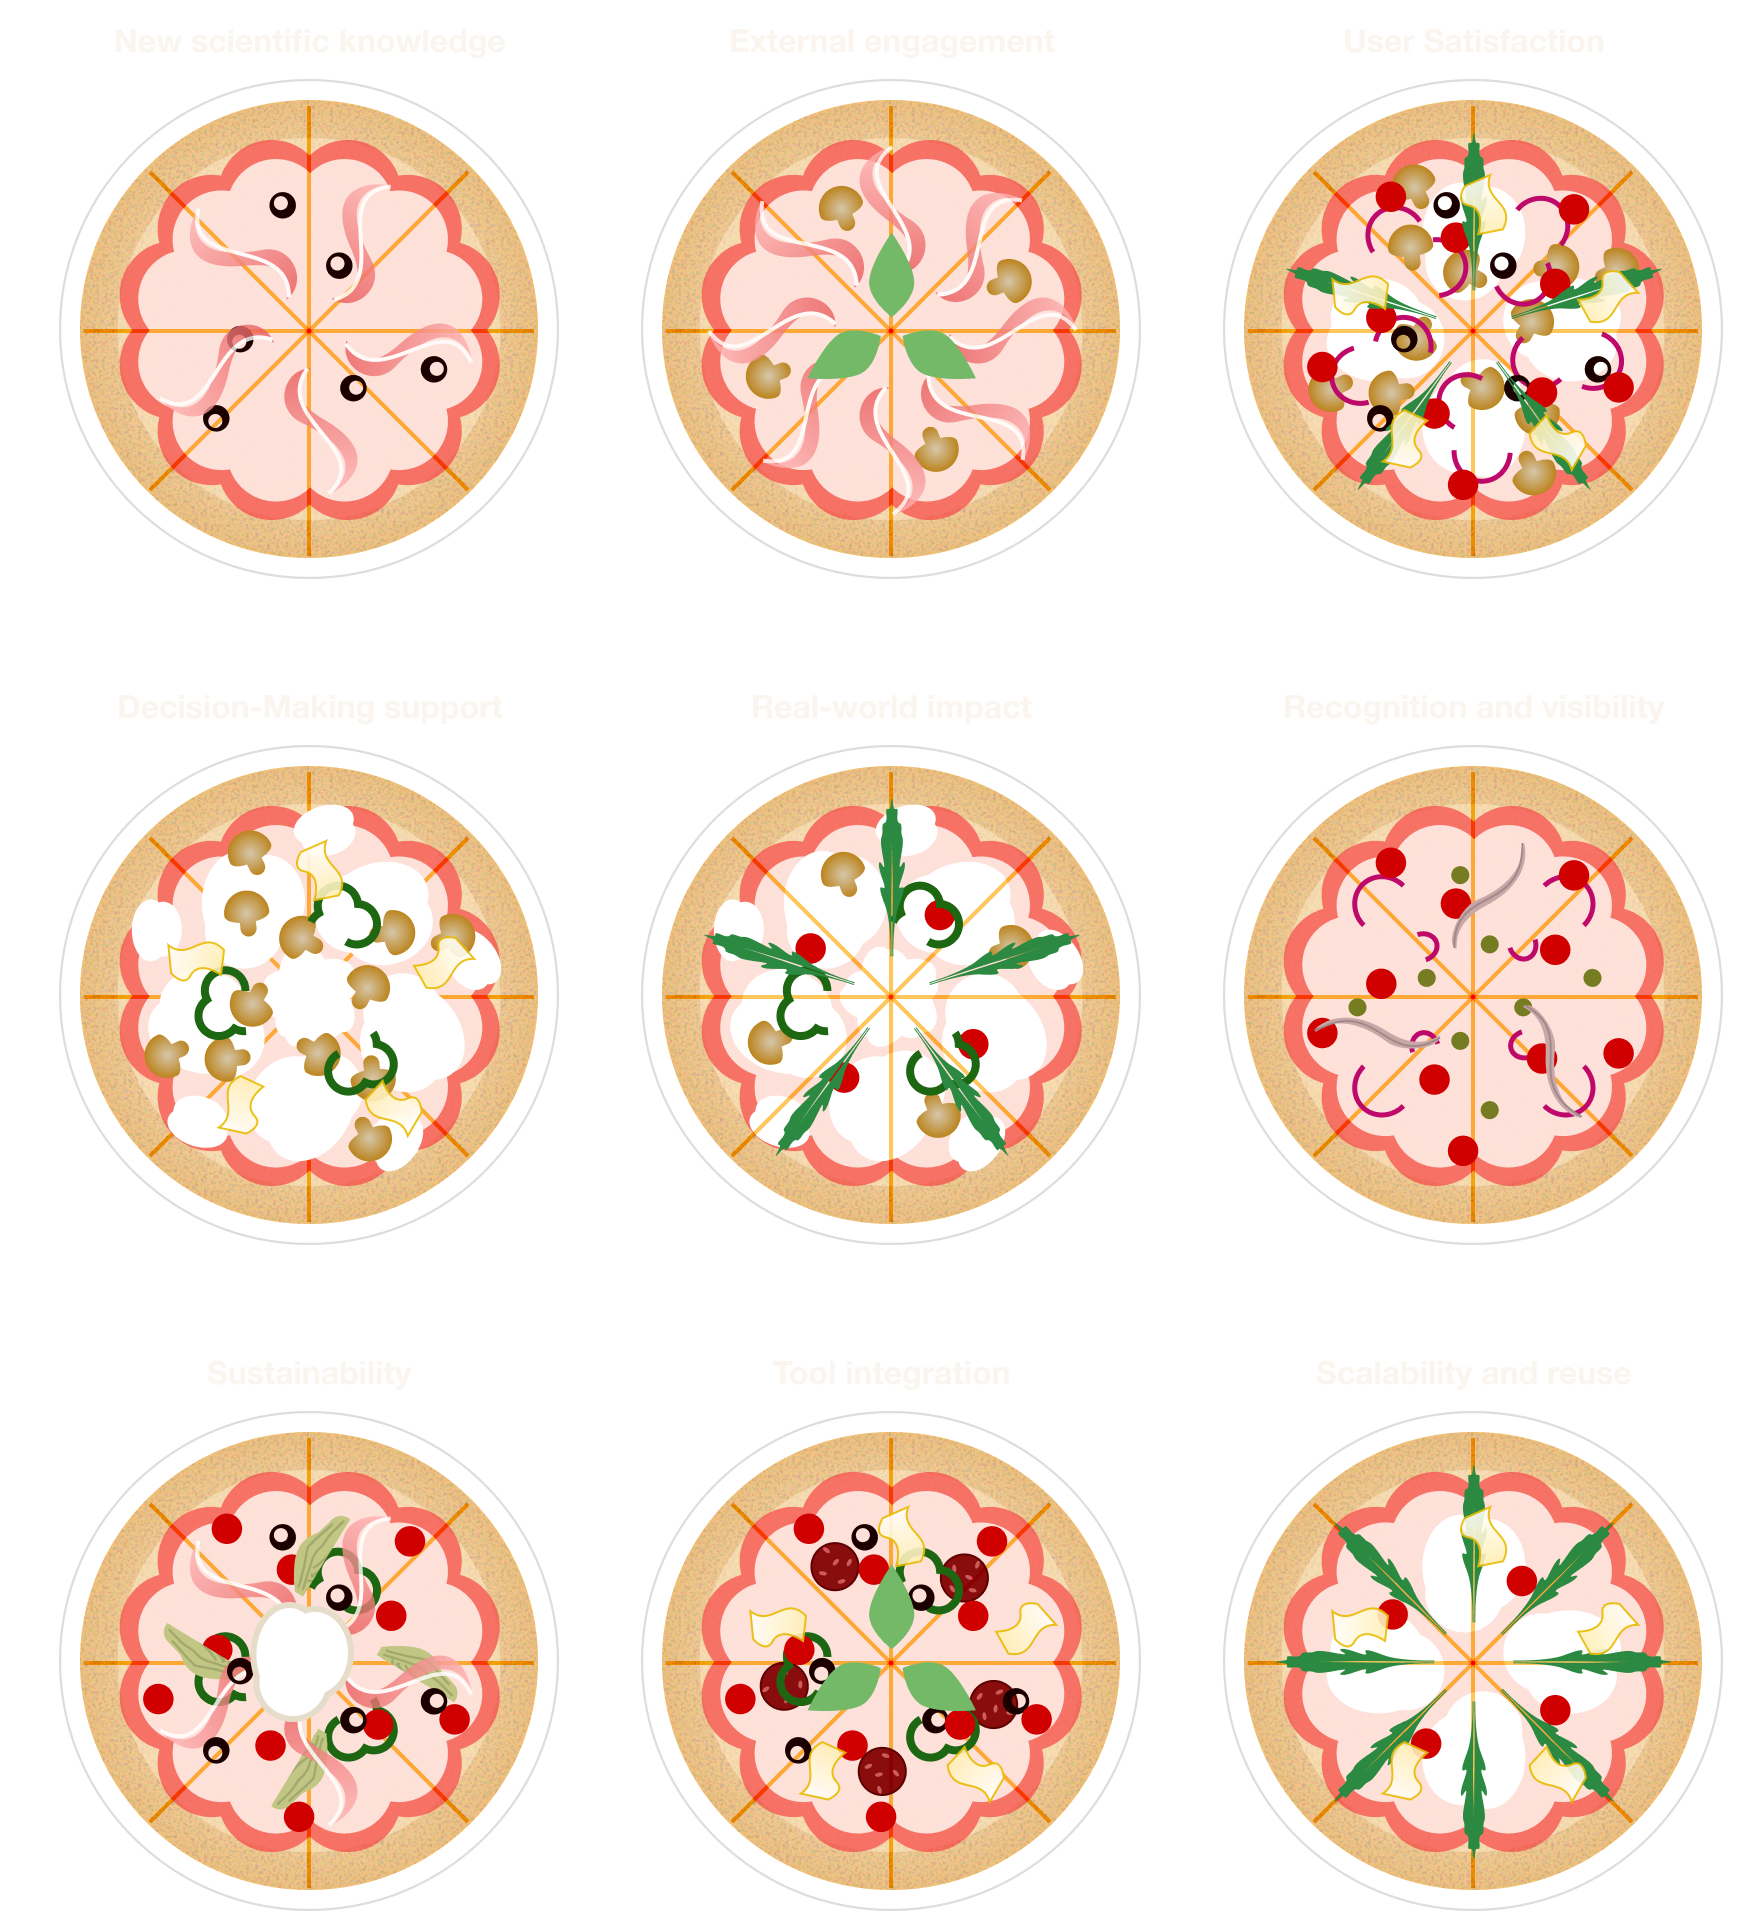
New scientific knowledge

Traceability
ham
1.04
User feedback
olives
1.04
External engagement

Traceability
ham
1.89
Salience
mushroom
1.16
Adaptability
basil
1.45
User Satisfaction

Good delivery practices
arugula
1.66
Market & innovation
fresh cheese
1.58
Narratives
red onions
1.58
Timeliness
cherry tomatoes
1.60
Salience
mushroom
1.64
User feedback
olives
1.18
Evaluation
parmesan
1.16
Decision-Making support

Market & innovation
fresh cheese
2.49
Salience
mushroom
1.60
Evaluation
parmesan
1.1
Timeliness
cherry tomatoes
1.60
Stakeholder mapping
bell peppers
1.05
Real-world impact

Good delivery practices
arugula
1.68
Market & innovation
fresh cheese
2.26
Timeliness
cherry tomatoes
1.00
Salience
mushroom
1.17
Stakeholder mapping
bell peppers
2.12
Recognition and visibility

Narratives
red onions
1.25
Timeliness
cherry tomatoes
1.73
Brokerage
capers
1.08
Uncertainties
anchovies
1.25
Sustainability

Market & innovation
fresh cheese
2.49
Timeliness
cherry tomatoes
1.73
Traceability
ham
1.04
User feedback
olives
1.04
Knowledge types
artichoke hearts
1.62
Tool integration

Timeliness
cherry tomatoes
1.52
User feedback
olives
1.41
Evaluation
parmesan
1.04
Quality assurance
salami
1.26
Adaptability
basil
1.47
Stakeholder mapping
bell peppers
1.47
Scalability and reuse

Good delivery practices
arugula
2.27
Market & innovation
fresh cheese
1.86
Timeliness
cherry tomatoes
1.31
Evaluation
parmesan
1.59
What's the data behind the pizza?

10 quality indicators based on a review of scientific literature and expert input.

Dataset of 54 European climate service projects obtained from CORDIS, the European Commission’s research platform.

18 criteria, grouped into the four climate services components: decision-making context, ecosystem of actors and co-production, diversity of knowledge systems, delivery mode and evaluation.
These are based on recommendations from Climateurope2, a project that aims to support and standardise climate services in Europe and beyond.
These are based on recommendations from Climateurope2, a project that aims to support and standardise climate services in Europe and beyond.

Presence or absence of each criterion and quality indicator in the projects identified using an LLM.
The most strongly linked criteria to different quality indicators identified by multivariate analysis. Because of the applied method, sometimes the absence of certain criteria can play a role too.
The most strongly linked criteria to different quality indicators identified by multivariate analysis. Because of the applied method, sometimes the absence of certain criteria can play a role too.
What do European climate service projects focus on?
The most common criteria across projects include: considering uncertainties in evaluation, assessment, and communication; using knowledge brokerage to facilitate information exchange among stakeholders; and incorporating user feedback and user support.
Uncertainties
Brokerage
User feedback
Conversely, transparency about the project scope appears less frequently.
Transparency of scope
Looking at quality indicators, the most common are external interest, real-world impact and creation of new scientific knowledge. Recommendations from users were rarely mentioned as in the projects, and the indicator was finally excluded from the analysis.
External Interest
Read-world impact
New scientific knowledge
Recommendations from users
The most frequently reported
criteria and indicators
criteria and indicators
These bar charts show the relative presence (in %) of criteria and indicators across the analysed projects. A diversity of criteria related to the different components are identified, whereas external interest appears as the most frequent indicator.

What drives climate services quality?
Explore the interactive chart to see how different criteria relate to different quality indicators. Analysed criteria are considered ‘good to have’, which means their presence in climate services is generally desired.
Use the “VIP relevant” filter to highlight the most important criteria
A bar with an outward orientation means that the presence of a criterion is associated with that type of quality indicator
A bar with an inward orientation means that the presence of a criterion is associated with that type of quality indicator
- Use the “VIP relevant” filter to highlight the most important criteria
- A positive sign (+) means that the presence of a criterion supports that type of success
- A negative sign (–) means that that absence of a criterion is associated with that type of success
Bar height represents the relative weight of each criterion within the corresponding indicator, enabling comparison of their contribution.
Click on the Indicator label in the center of the chart to see it in detail
Click on the Indicator label in the center of the chart to see it in detail
What stands out

User satisfaction and Long-term sustainability are the best predicted quality indicators, followed by External interest, Tool integration, Real-world impact.

User satisfaction is mainly driven by the presence of criteria from the delivery mode component and the decision-making context.

Long-term sustainability draws on criteria from all four components, although interestingly, many sustainable projects do not mention application of co-production practices.



Build your recipe
Continue exploring!
This network visualization represents the relationships between criteria and indicators. Link width represents the frequency of occurrence of these relationships across projects.
This network visualization represents the relationships between criteria and indicators. Link width represents the frequency of occurrence of these relationships across projects.
Select an ingredient to see how it contributes to different types of quality
Or start with a quality indicator and discover the best combination of ingredients behind it.
- Use the “VIP relevant” filter to highlight the most important criteria
- A positive sign (+) means that the presence of a criterion supports that type of success
- A negative sign (–) means that that absence of a criterion is associated with that type of success
Want to submit your successful climate service case study?
Contact us to collaborate or for more information.

info@climagap.es